marlin has a lot of features built into it to simulate
dynamics over time. However, we cannot possibly build in every possible
use case a researcher might have.
To that end, and important feature of marlin is that the
outputs of a marlin simulation can be passed as the input
to a marlin simulation. This means you can run the model
for one time step, insert whatever whacky stuff you want to do,
then run a new step.
As an example, we’ll do a very cartoonish version of a “management strategy evaluation”, where we
Simulate a fishery for a time step
Simulate a perfect stock assessment that tells us depletion (biomass / unfished biomass)
Applies a harvest control rule that sets a catch quota based on the results of our assessment
Run another time step with the supplied quota.
Repeat process
library(marlin)

library(tidyverse)
#> ── Attaching core tidyverse packages ──────────────────────── tidyverse 2.0.0 ──
#> ✔ dplyr     1.2.1     ✔ readr     2.2.0
#> ✔ forcats   1.0.1     ✔ stringr   1.6.0
#> ✔ ggplot2   4.0.3     ✔ tibble    3.3.1
#> ✔ lubridate 1.9.5     ✔ tidyr     1.3.2
#> ✔ purrr     1.2.2
#> ── Conflicts ────────────────────────────────────────── tidyverse_conflicts() ──
#> ✖ dplyr::filter() masks stats::filter()
#> ✖ dplyr::lag()    masks stats::lag()
#> ℹ Use the conflicted package (<http://conflicted.r-lib.org/>) to force all conflicts to become errors

theme_set(theme_marlin(base_size = 14))

resolution <- 10 # resolution is in squared patches, so 20 implies a 20X20 system, i.e. 400 patches

burn_years <- 20

seasons <- 4

sim_steps <- 20 * seasons


time_step <- 1 / seasons

fauna <-
  list(
    "striped marlin" = create_critter(
      scientific_name = "Kajikia audax",
      adult_diffusion = 10,
      seasons = seasons,
      fished_depletion = 0.25,
      resolution = resolution,
      steepness = 0.6,
      ssb0 = 1000
    )
  )


fleets <- list(
  "longline" = create_fleet(
    list("striped marlin" = Metier$new(
      critter = fauna$`striped marlin`,
      price = 10,
      sel_form = "logistic",
      sel_start = .25,
      sel_delta = .01,
      catchability = 0,
      p_explt = 2
    )),
    base_effort = resolution^2,
    resolution = resolution,
    cost_per_unit_effort = 100,
    fleet_model = "open access",
        spatial_allocation = "ppue"
  ),
  "handline" = create_fleet(
    list("striped marlin" = Metier$new(
      critter = fauna$`striped marlin`,
      price = 10,
      sel_form = "logistic",
      sel_start = 0.5,
      sel_delta = .01,
      catchability = 0,
      p_explt = 1
    )),
    cost_per_unit_effort = 1000,
    base_effort = resolution^2,
    resolution = resolution,
    fleet_model = "constant effort",
    spatial_allocation = "ppue"
  )
)

fleets <- tune_fleets(fauna, fleets, tune_type = "depletion", tune_costs = TRUE)


hcr_cutoff <- 0.1

hcr_target <- 0.5

max_u <- 0.021

depletion <- seq(0, 1, by = 0.1)

hcr_slope <- max_u / (hcr_target - hcr_cutoff)

hcr_intercept <- -hcr_slope * hcr_cutoff

hcr <- pmin(max_u, pmax(.01, hcr_slope * depletion + hcr_intercept))

hcr_frame <- data.frame(depletion = depletion, hcr = hcr)

hcr_frame %>%
  ggplot(aes(depletion, hcr)) +
  geom_line() +
  scale_x_continuous(name = "B/B0") +
  scale_y_continuous(name = "Fishing Mortality Rate")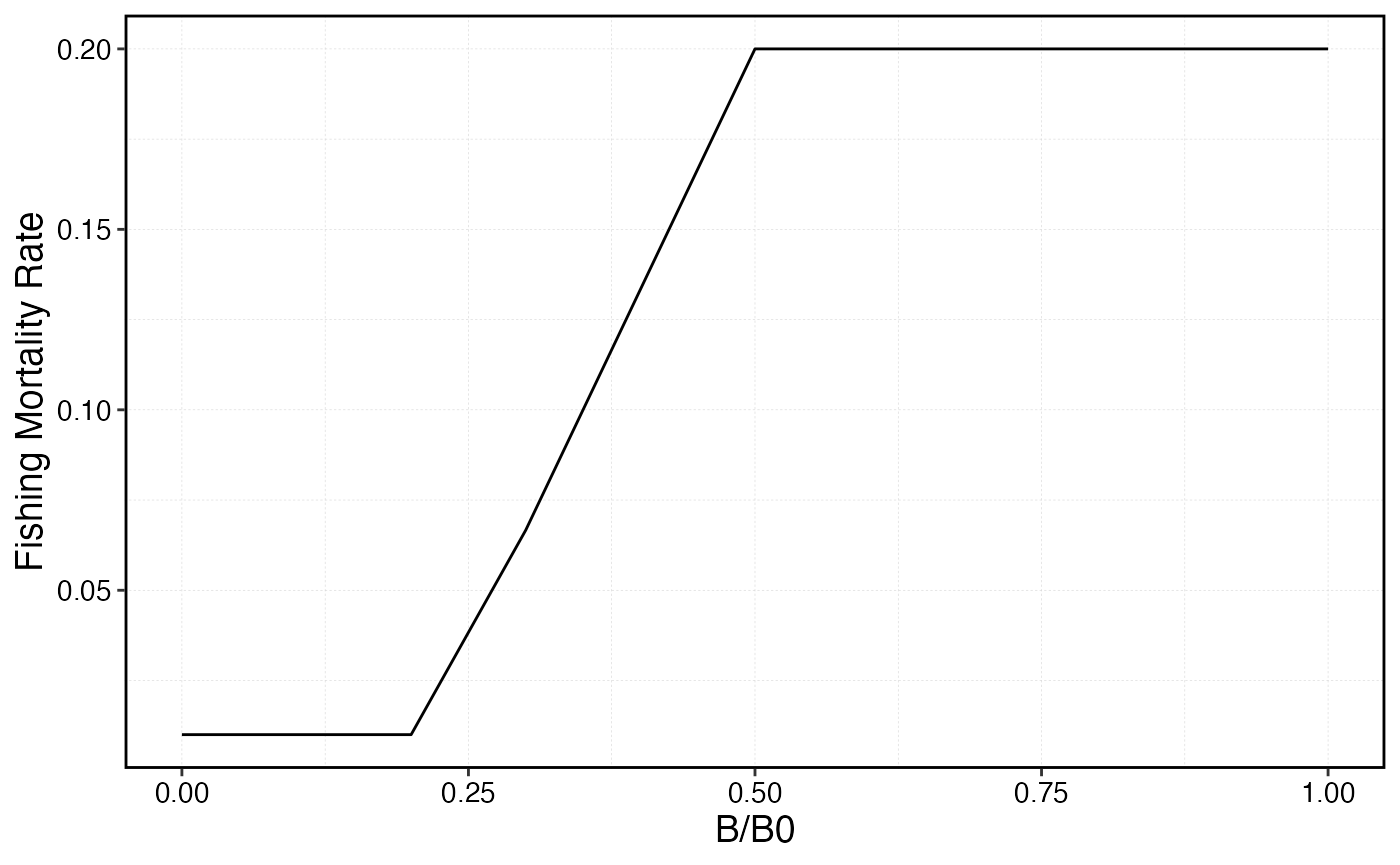
mse_sim <- simmar(
  fauna = fauna,
  fleets = fleets,
  years = burn_years
)

test <- process_marlin(mse_sim, keep_age = FALSE)

initial_conditions <- mse_sim[[length(mse_sim)]]

starting_step <- marlin::clean_steps(last(names(mse_sim)))

for (y in 2:sim_steps) {
  depletion <- purrr::map(mse_sim[[length(mse_sim)]], ~ sum(.x$ssb_p_a) / .x$ssb0)

  u <- map(depletion, ~ pmin(max_u, pmax(0.01, hcr_slope * .x + hcr_intercept)))

  quotas <- purrr::map2(mse_sim[[length(mse_sim)]], u, ~ sum(.x$ssb_p_a) * .y)

  next_step <- simmar(
    fauna = fauna,
    fleets = fleets,
    steps = 1,
    initial_conditions = initial_conditions,
    manager = list(quotas = quotas),
    starting_step = starting_step,
    keep_starting_step = FALSE
  )

  initial_conditions <- next_step[[length(next_step)]]

  starting_step <- marlin::clean_steps(last(names(next_step)))

  mse_sim <- append(mse_sim, next_step)
}


processed_mse_sim <- process_marlin(mse_sim)

a <- processed_mse_sim$fauna |>
  group_by(step, critter) |>
  summarise(ssb = sum(ssb))
#> `summarise()` has regrouped the output.
#> ℹ Summaries were computed grouped by step and critter.
#> ℹ Output is grouped by step.
#> ℹ Use `summarise(.groups = "drop_last")` to silence this message.
#> ℹ Use `summarise(.by = c(step, critter))` for per-operation grouping
#>   (`?dplyr::dplyr_by`) instead.

b <- processed_mse_sim$fauna |>
  group_by(step, critter) |>
  summarise(c = sum(c))
#> `summarise()` has regrouped the output.
#> ℹ Summaries were computed grouped by step and critter.
#> ℹ Output is grouped by step.
#> ℹ Use `summarise(.groups = "drop_last")` to silence this message.
#> ℹ Use `summarise(.by = c(step, critter))` for per-operation grouping
#>   (`?dplyr::dplyr_by`) instead.


plot_marlin(processed_mse_sim, plot_var = "c", max_scale = FALSE)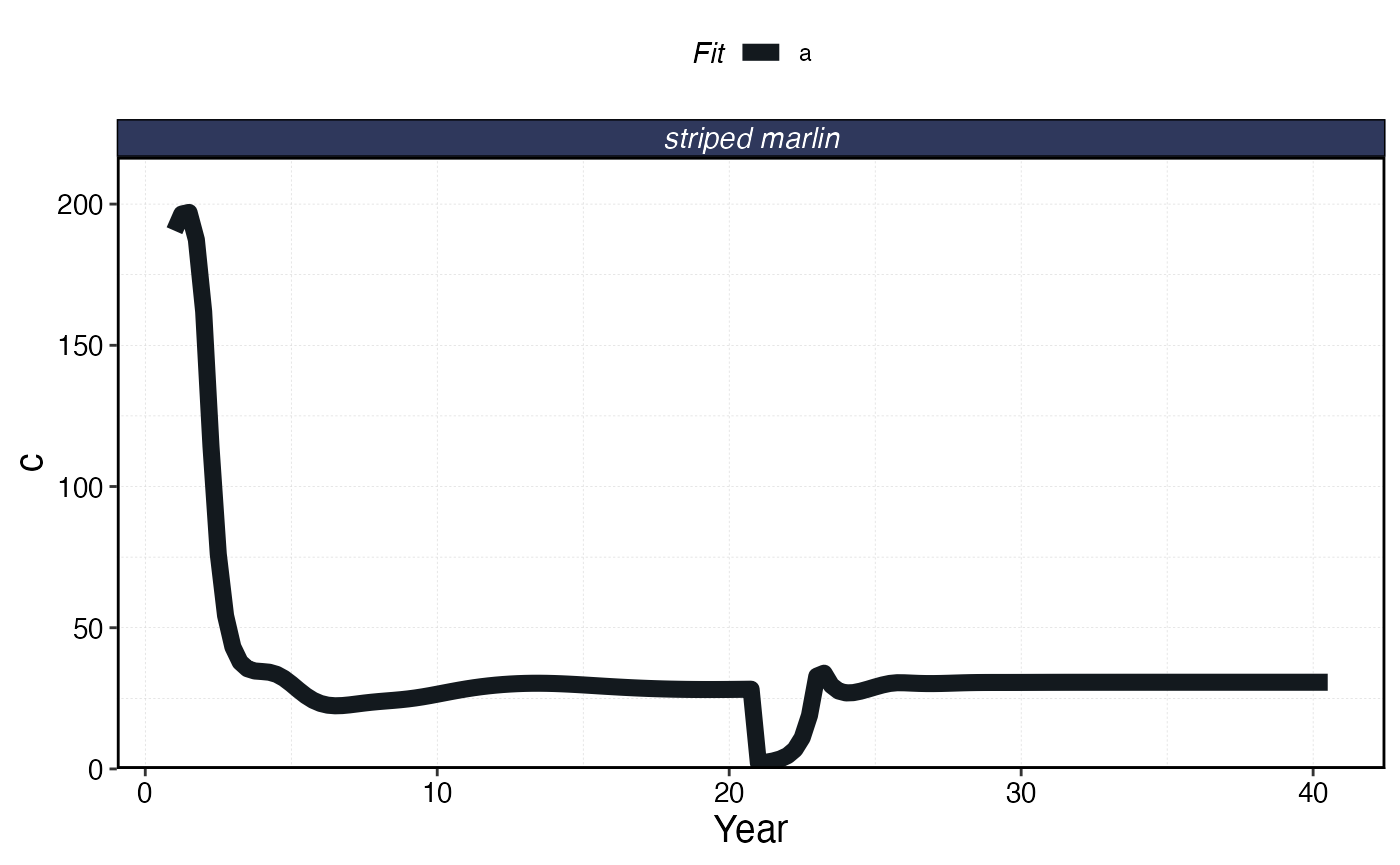
plot_marlin(processed_mse_sim, plot_var = "b", max_scale = FALSE)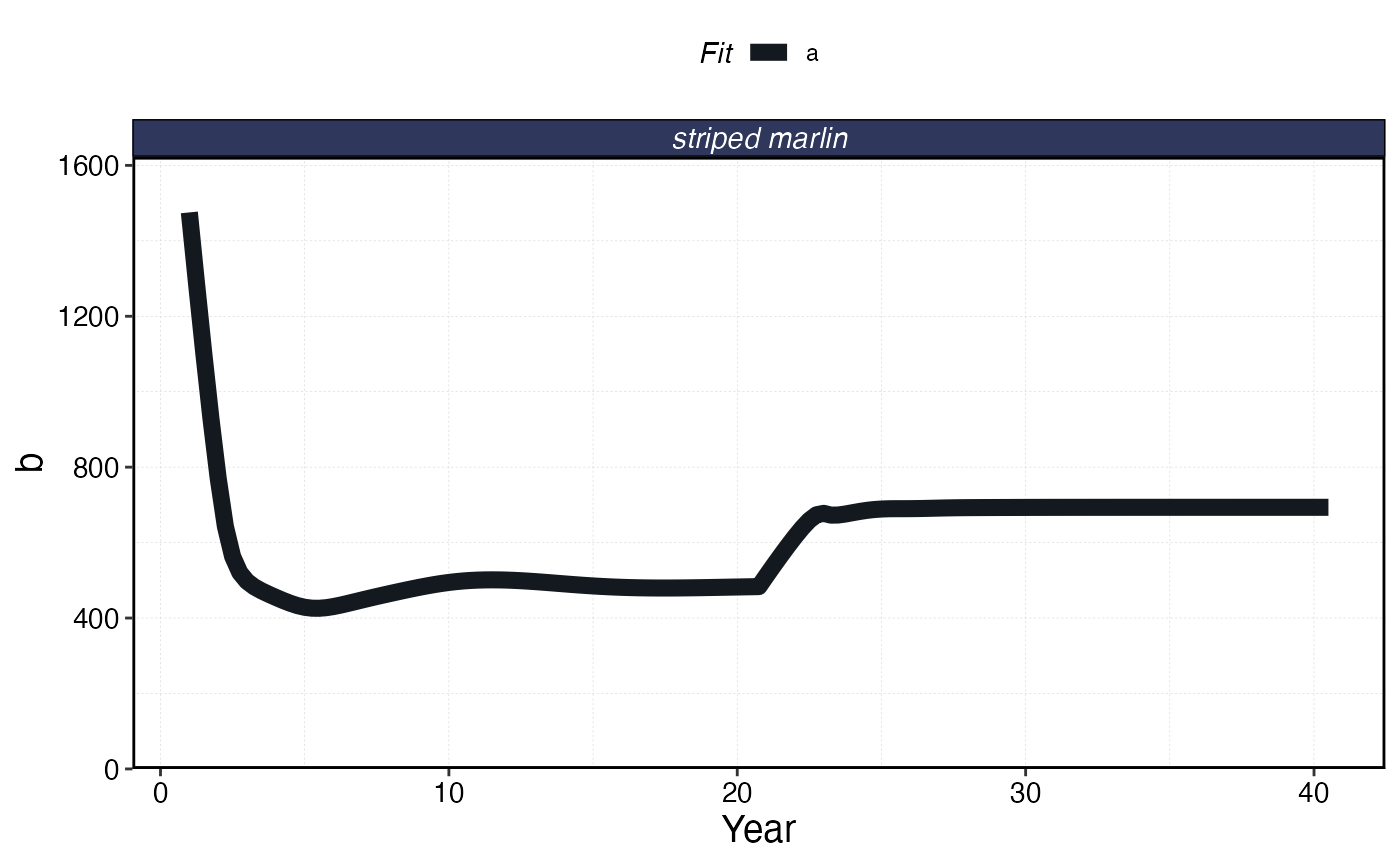
plot_marlin(processed_mse_sim, plot_var = "ssb", max_scale = FALSE)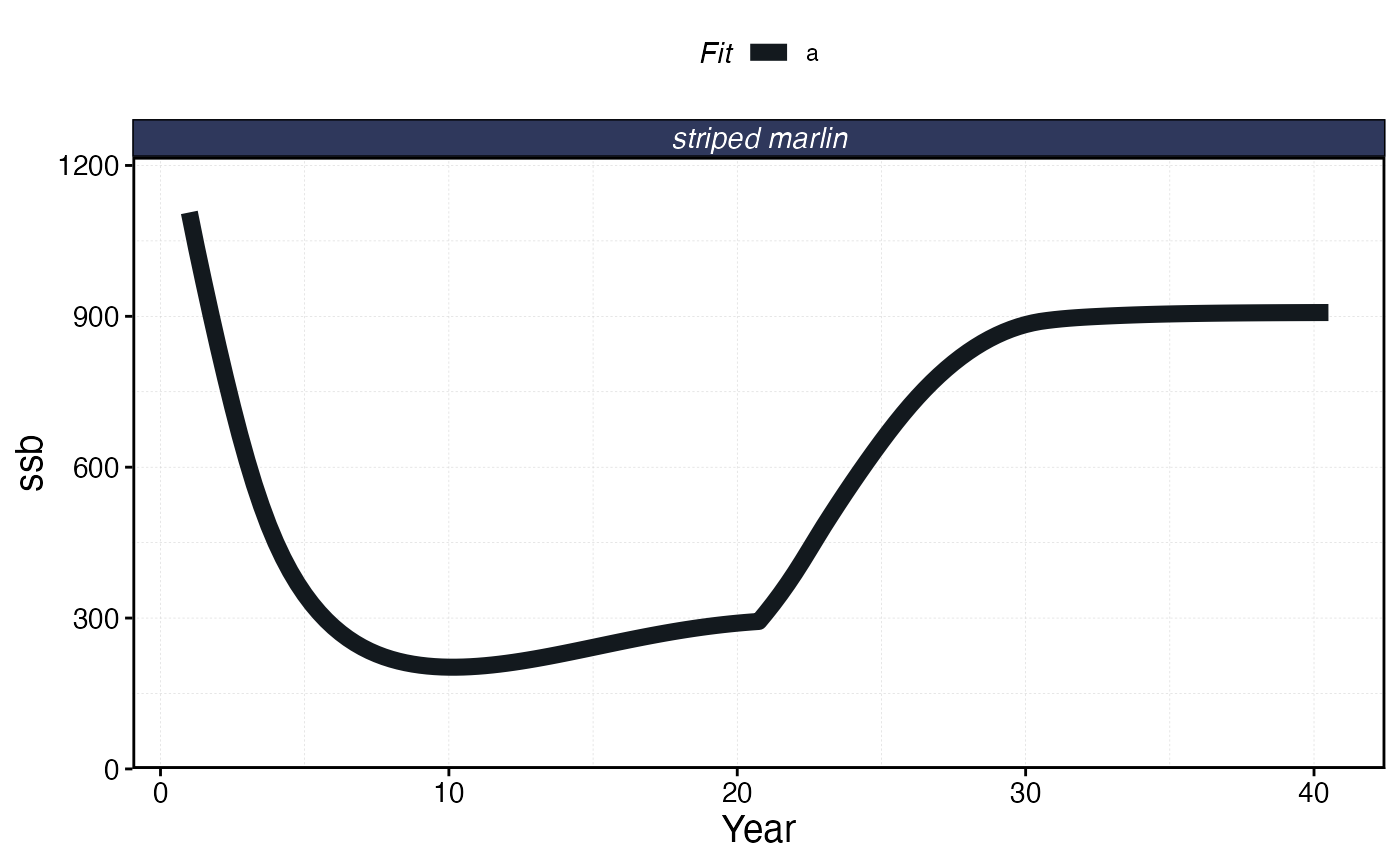
# plot_marlin(processed_mse_sim, plot_type = "space")